“Now, here, you see, it takes all the running you can do, to keep in the same place. If you want to get somewhere else, you must run at least twice as fast as that!” Red Queen tells Alice.
Alice might find the market’s rise quite satisfying. How satisfactory! -she may think. However, the Red Queen’s advice is crucial. You must run as fast, to get the same what you got in the markets. And twice fast – to get what you may desire!
Too cryptic. I know. So let’s talk straight stuff.
This blog dives into what could happen if the markets follow historical trends. It might sound like just a bunch of stats, but it could be a useful tool to gauge future. That’s because asset returns often mean revert. We’re not just talking about the nominal returns, but also the real returns and the extra returns over bonds (called risk premiums), all while considering inflation and bond yields. Definitions- see in the box.
Nominal Returns: This is SENSEX’s return as we observe. With no adjustment there. I calculate rolling return of SENSEX for an investor with an investment horizon of a decade.
Real Returns: To determine the Real Sensex, I adjust the Sensex for inflation using the Consumer Price Index (CPI). Then, I calculate the 10-year rolling returns for investors who invested every quarter over the past 20-30 years- this gives me real return series. The median returns of this series is representative of the returns an investor would have achieved for a 10-year holding period.
Risk Premium: I construct a 10-year government bond index, simulating an investment in a constant maturity 10-year government bond. The difference between the bond index return and the Sensex return is called risk premium. I make a series of SENSEX to bond index. The 10 year rolling return of this series gives us excess return that SENSEX earned over bonds. The median returns of this series is representative of the returns an investor would have achieved for a 10-year holding period.
Mechanism of projecting next 5 year returns: I assume that the returns of SENSEX over next five years may be such that the nominal returns, real returns and excess returns of 2019-2029 are equal to past median returns. With this assumption- I project next 5 year returns.
All of these calculation ignores dividend yield. So add 1-1.5% to get the total return of the market.
Historical SENSEX returns
If an investor started investing in the Sensex every quarter from 1994 or 2004 and held the positions for a decade, the median and average 10-year rolling returns for each of his investment will be as given in the table, column 3. The range is 10.85%-12.80%. Just for reference, since 1994 and 2004, SENSEX has grown at 14.4% and 10.4%. So the point to point return of SENSEX and average 10 year rolling return can be very-very different.

For an investor of 10 year holding period, since 2004- the SENSEX delivered near 10.90%. On average. If the Sensex were to deliver similar returns for 2019-29, it will reach 108,324 in 2029(column 4). That means, SENSEX will deliver meagre 5.5% return over next 5 years. In the best case, if the 10-year return matches the median return since 1994, the CAGR could still be only 9.2%.
These numbers seem too lowish- as they project just 5-9% return for SENSEX over next 5 years? Reason is simple – Since great many returns have been extracted of past 5 years (16.5%), the next 5 years return will have to be muted- to ensure that SENSEX delivers median returns of the past.
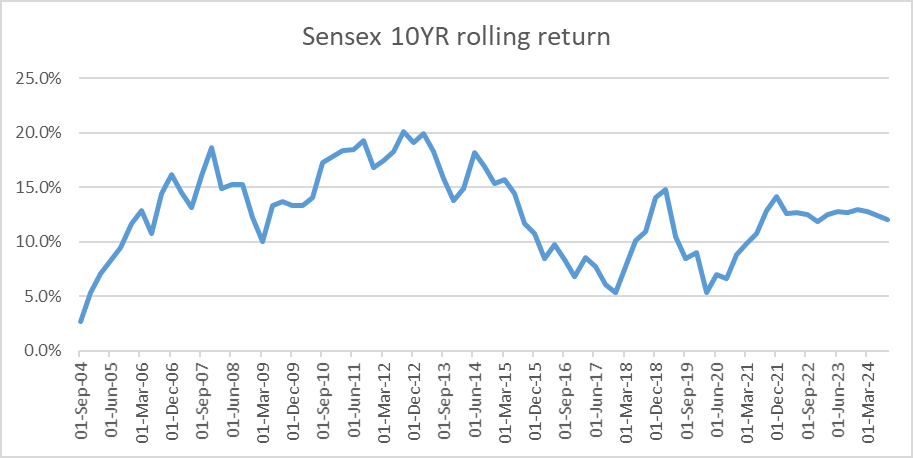
The chart below will give you a sense of how the 10 year rolling returns oscillate. FY18, this number had drifted down to 5%. And during the great bull market of the first decade of 2000, it hit 20%.
Real Sensex Returns
Now, let’s consider the Real Sensex, which is the Sensex return adjusted for inflation. Spend a minute on the table below. The logic is same that we used in the previous section.
If an investor started investing in the Sensex in 1994 and continued to invest every quarter, the first row shows median 10-year rolling returns. This helps understand the typical returns such an investor would have experienced over that period. Assuming he median REAL returns for his investment in 2019, we can project the SENSEX in 2029 (last column). Here I am making another assumption – that inflation will be 4.5%. Close to what we have had over past decade.

I think, SENSEX will deliver better than these numbers. They seem too pessimistic. But you only have to keep this in mind that the above returns are also in the realm of possibility- if real returns of the markets were to mean-revert.
Reminding you here – that this is purely a statistical exercise.
The chart below is Real SENSEX. You know this that- real returns only matter- really. Not nominal. Real SENSEX was at the same level in 2013 as 1992’s. That’s 21 years of flat markets. If you invested at peak 2008 level, even though the nominal SENSEX peak was reclaimed in 2010 and 2013, only in 2021 you reclaimed the 2008 peak in real terms.
This reveals how brutal the underperformance tends to be – if inflation eats your returns or if you buy very expensive markets.
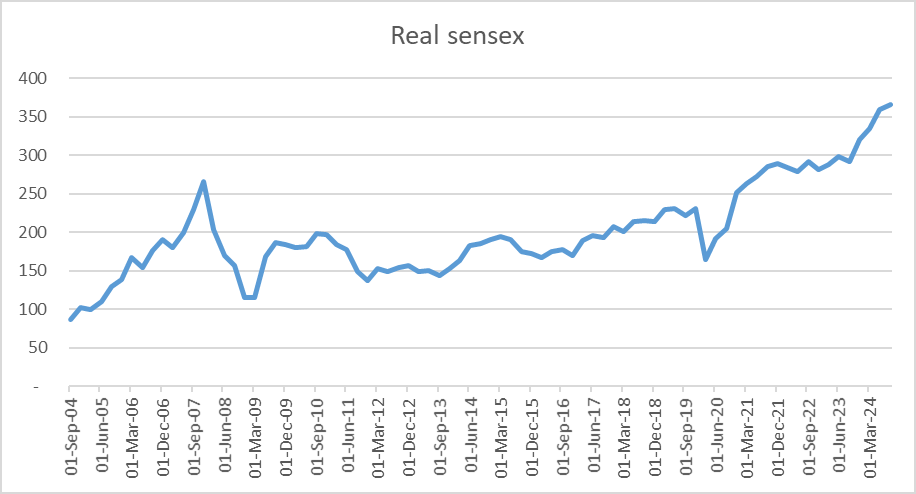
Real SENSEX also seems more volatile than SENSEX (I haven’t checked the standard deviation of this series though).
The current 10-year real return is around 7%, which is close to the median real return for 10-year investor since 1994, but twice of median return since 2004. Look at the chart here. Such a wide range of 10 year rolling returns in real terms.
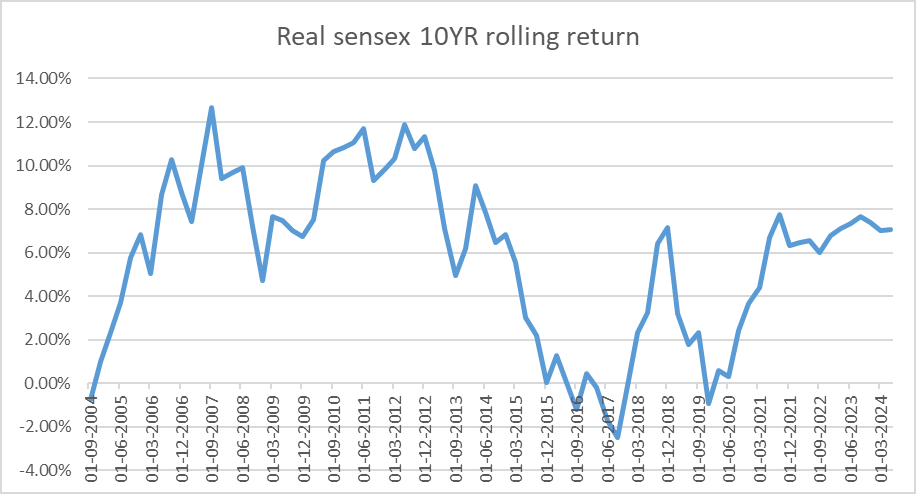
Your key take away is not that the past 5 year’s great performance is projecting fairly pessimistic picture. Important take away is that the long term is not a panacea for a bad macro (inflation) or expensive markets. If you have dialled up risk in bad times – the returns can be super-low or zero for 10- 20 years.
Sensex Risk Premium Over Bonds
My favourite way to look at SENSEX’s performance is to look at how it delivered vs bonds. It is the best metric for asset allocators. This difference in returns of equity vs bond is called excess returns or risk premiums. If your 10-year bond gave 8% and SENSEX delivered 12%, you will call this 4% difference between these two, as risk premium. That is the extra you want for the risk you take in equities. Don’t you?
See the table below. This risk premium number has been 3.5-4%. Fairly tight range. Assuming the same is delivered in 2019-29, the SENSEX will get to 96k to 107k, delivering just 3-5% return to the investors who buys it at current level.

Even though the last 10 years rolling returns of SENSEX look very high, the excess return over bonds is only 3.5%. So some of the great returns in SENSEX have simply been due to lower rates.
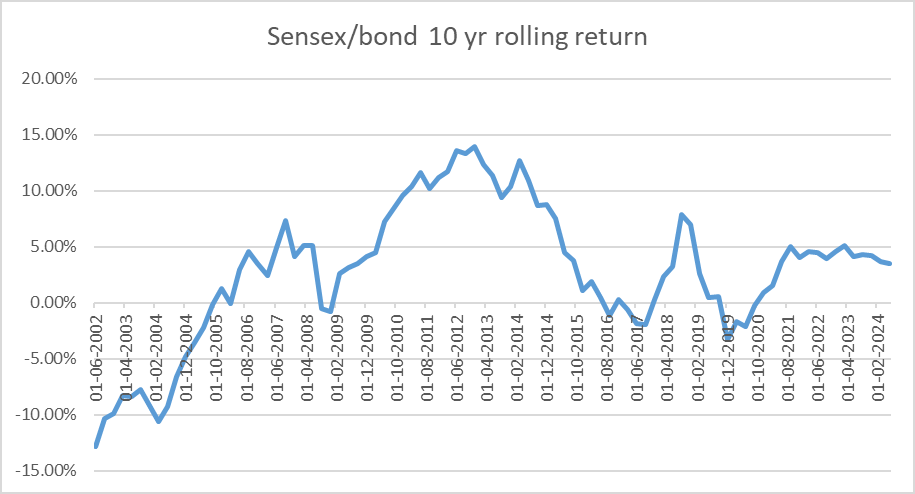
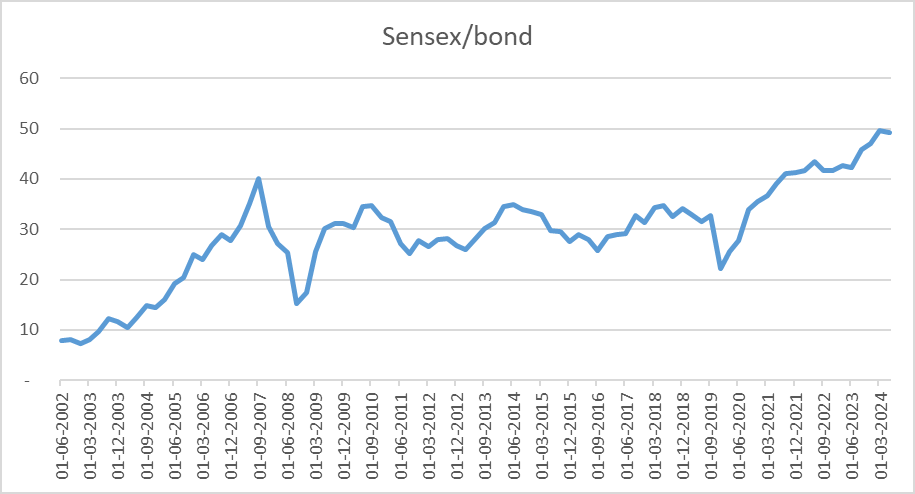
Now a little interesting data here. You may want to spend a min extra reading it. The following chart is SENSEX/10-year bond ratio. This tells you how SENSEX has moved vis a vis 10-year bond over last few decades.
Many people don’t recognise that post 2013, until 2021, ratio is flat. So 10-year bond delivered as much as SENSEX. Even more importantly, observe what had happened after 1992. Relative to bonds, SENSEX was down 75% even after a decade, and was flat for 30 years. So SENSEX made zero extra returns vs 10-year bond? You would have earned dividend yield of course, about 1.5%. The same thing can be said for someone who invested in 2008. 15 years of flat markets, relative to bonds!
Conclusion
My idea is to introduce you to three ideas.
One, that past 5 years returns have been extraordinary and are totally different from what historical returns have been.
Two, excess return over bonds and real returns of SENSEX tend to be very volatile even if you hold the positions for a decade or long.
Don’t forget that if you buy at a wrong time (Bad macro or very high valuations) future returns can be brutally low.
Take some time to really dive into the real and excess return charts. The more you look, the more stories they’ll tell you.
You might think this “Bond guy” doesn’t get the great things happening in our country. But is that really the case? Write to me at blog@mosaicamc.com
I will be writing here on markets more regularly. Not advising. Writing, because I like doing it.

Red Queen: “Speak when you’re spoken to!” The Queen sharply interrupted her.
Alice: “But if everybody obeyed that rule,” said Alice, “and if you only spoke when you were spoken to, and the other person always waited for you to begin, you see nobody would ever say anything, so
that—”
Red Queen: “Ridiculous!” cried the Queen. “Why, don’t you see, child—” here she broke off with a frown, and, after thinking for a minute, suddenly changed the subject of the conversation.
Alice: “I only said ‘if’!” poor Alice pleaded in a piteous tone.
Red Queen: “Always speak the truth—think before you speak—and write it down afterwards.”

